Measuring the effectiveness of a network at connecting different individuals and organizations is complex. Collaboration Mapping is a fresh learning tool to help any evaluator understand the multi-faceted components of a network.
This approach, originally developed by USAID/Rwanda, graphically depicts an organisation’s relationships with its key stakeholders.
Khulisa used Collaboration Mapping as an evaluation method to analyse three DFID-funded networks, two of which are funded under the programme Strengthening African Networks for Governance, Accountability and Transparency (SANGAT).
Identifying the weakest links
The Collaboration Mapping approach identifies key partners in a network and the way they interact with one another. It also maps the strength of the relationships between the partners.
The SANGAT project comprises two networks: the Asset Recovery Inter-Agency Network Southern Africa (ARINSA) and the Collaborative Africa Budget Reform Initiative (CABRI). The third network being evaluated is Twende Mbele.
To define the relationship strength between the different stakeholders in the three networks, the evaluator applies the following parameters:
- The stakeholder’s resource and non-resource-based influence on the organisation’s goals
- Financial flows between the organisation and each stakeholder
- Frequency of interaction between the organisation and each stakeholder
Through the process, an organisation can monitor stakeholder engagement and identify the specific relationships that require strengthening.
Insights on network connectivity
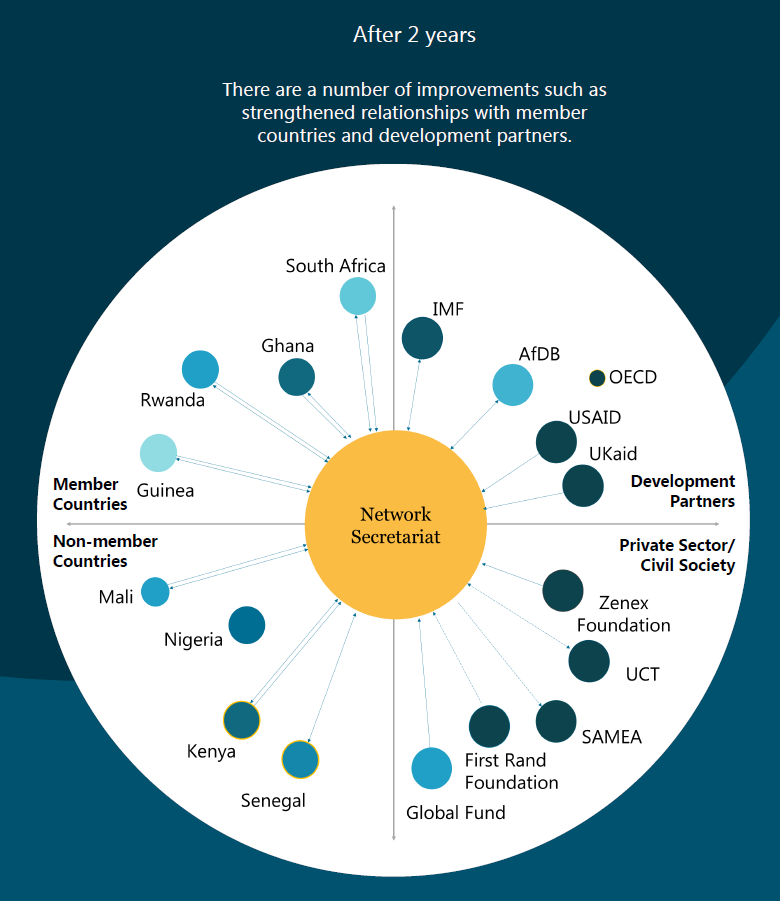
Collaboration Mapping can also be adapted for network analysis to determine network connectivity and serve as a monitoring tool for stakeholder engagement.
Through a facilitated process, the network secretariat and network partners (such as member countries, donors, and other stakeholders) explore the connectivity of various partners within the network.
The approach also explores the level of interaction between the network Secretariat and each programme partner.
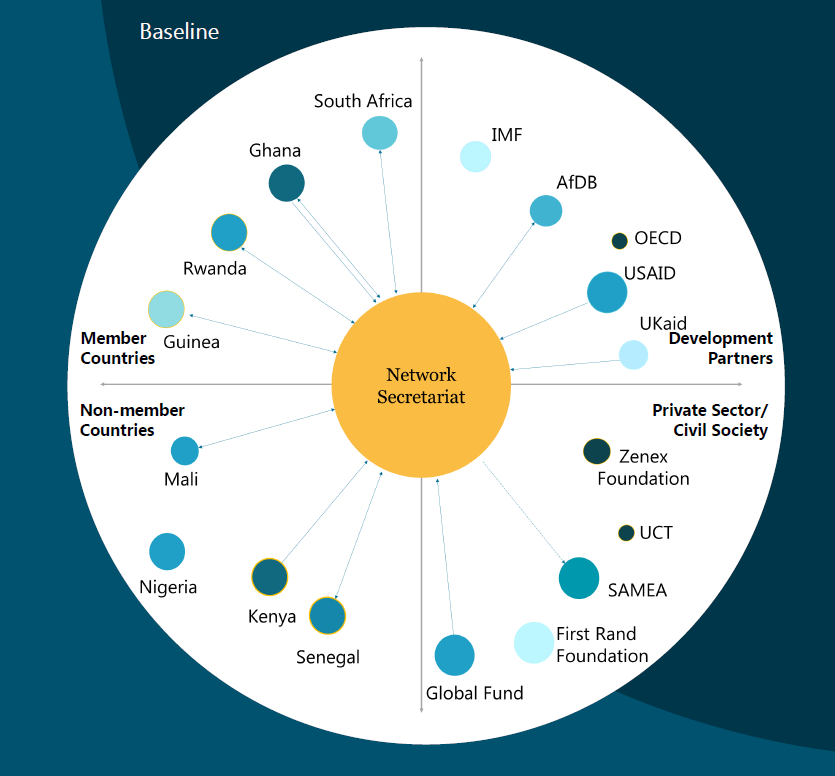
An example of a baseline collaboration map using illustrative data. It is not reflecting any specific country, network or development partner.
The result is a collaboration map which can be used to monitor the Secretariat’s engagement with member country governments, bi-lateral and multi-lateral partners, civil society and other stakeholders.
It can also help the network’s Secretariat understand where they need to build and nurture relationships, especially critical relationships that currently rely on a single contact.
Why is it a useful methodology?
- Provides a visual representation of relationships with key stakeholders, highlighting:
- Who does the organization interact with the most or the least
- Direction of financial flows and other resources
- Which relationships should be strengthened or prioritized
- Allows organizations to think strategically about their current and future relationships with different stakeholders
- Presents a good monitoring tool for stakeholder engagement (shows shifts over time)
- Informs stakeholder engagement and fundraising activities
- Checks the relevance of stakeholders to the program (the map can identify the stakeholders in the network that the organization does not work closely with)
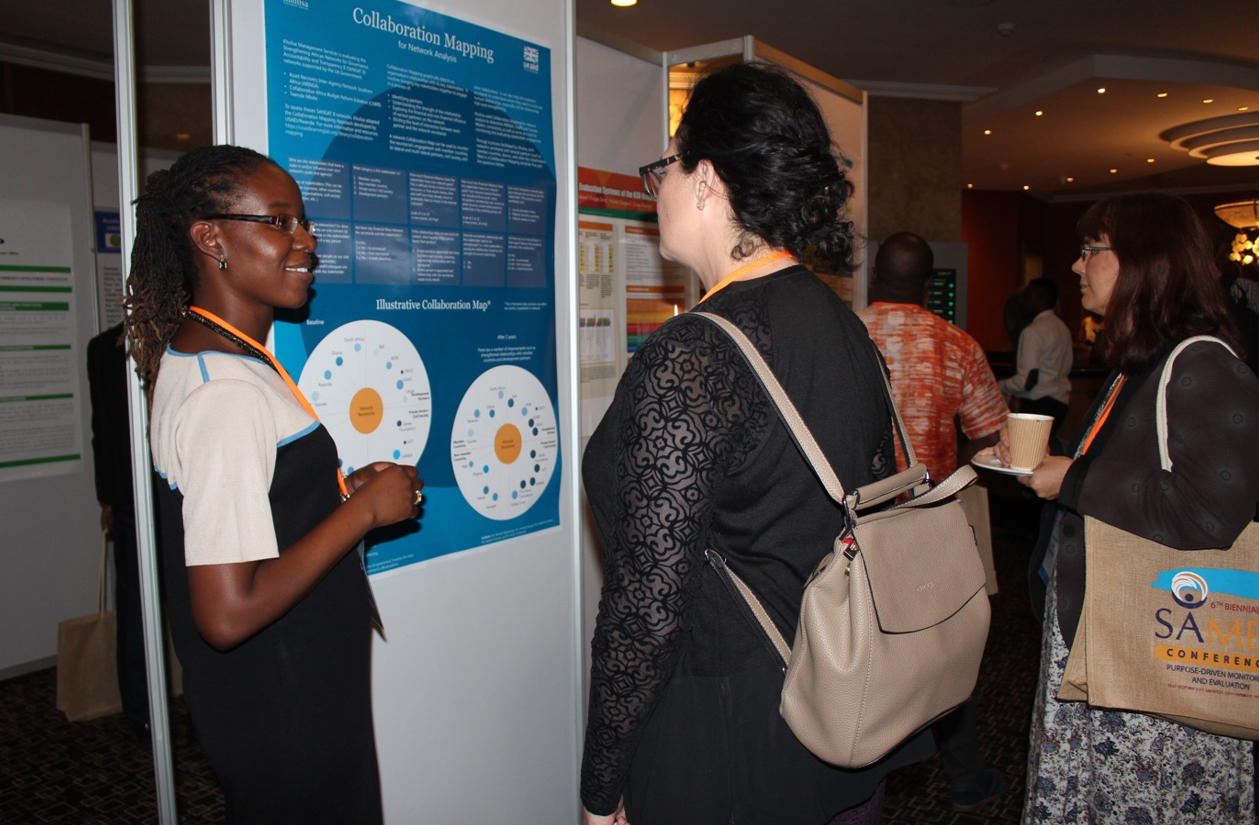
This blog forms part of a poster that was presented at the 6th SAMEA Conference under the Lessons learnt from evaluation case studies strand.