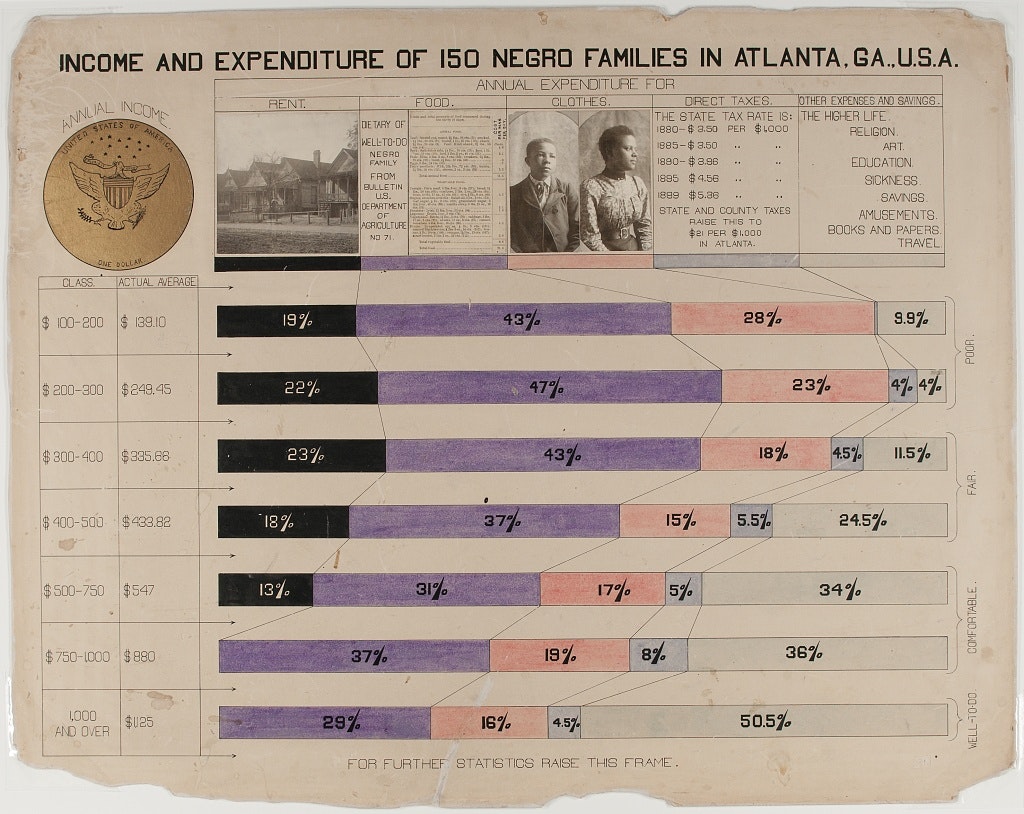
Khulisa was inspired by these set of historic infographics, developed by activist W.E.B. Du Bois in 1900, to challenge white supremacy. It’s sobering to realise that we are fighting racism to this day, but nonetheless encouraging to see how #dataviz has been deployed since the turn of the century to bring about social change.
We also discovered other resources showing how infographics and data visualisations have evolved through the ages. This article in The Smithsonian depicts the surprising history of the infographic. In this blog by visual.ly one gets a better understanding of how data visualization has evolved, and this catalogue of historical #dataviz is rich in examples of early 20th century visualisations.