Khulisa has extensively used data visualization in its evaluations over the last 10 years. Our first infographic was used to convince policy makers to change policies and procedures related to high school dropouts in 2011. Here are two of Khulisa’s #EvalTuesdayTip on data visualization:
- Data Visualization: How to make data attractive part 1
- Data Visualization: How to make data attractive part 2
Now we are moving towards data storytelling to further improve utilization and to ensure that our evaluation message is heard. It’s a natural fact that humans tell stories and, in turn, it is naturally these stories that make us ‘human’.
“Data visualization and data storytelling, while intertwined, are two very different practices; the former involves creating a visual representation of collected information, and the latter is about using human communication to help an audience develop a connection to that information.”
Data Storytelling is reliant on a compelling narrative. Like all stories, the Harvard Business Review says there should be “a hook, momentum, or a captivating purpose.” There should be a time element (typically linear) and it should show change. It should engage the evaluation audience so that they can understand the concepts and the underlying data more effectively. Here is an example of a data storytelling showing how Americans have changed their diet over the last 40 years.
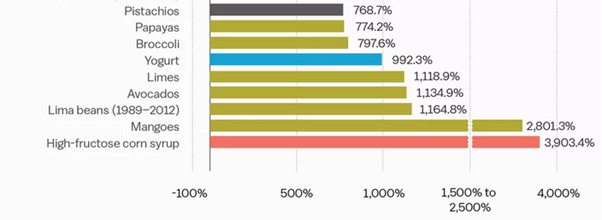
This excerpt of the chart shows that Americans are eating 2,801% more mangoes (and other cool foods such as avocados, limes, papayas and pistachios) than our parents 40 years ago. This tells the story of how globalization makes tropical fruit and nuts more available. Worryingly the chart also shows that Americans consume over 3,000% more high fructose corn syrup, which is a massive contributor to obesity.
We need to know how to visualize the significance of the data in a way to enhance understanding and connection. By combining the insights obtained from the data with a relatable story that displays the significance of the data, we improve our communication effectiveness. Data storytelling enables an evaluator to reach a broader audience, giving it the opportunity to make a greater impact.
Reference: https://agencyanalytics.com/blog/data-storytelling