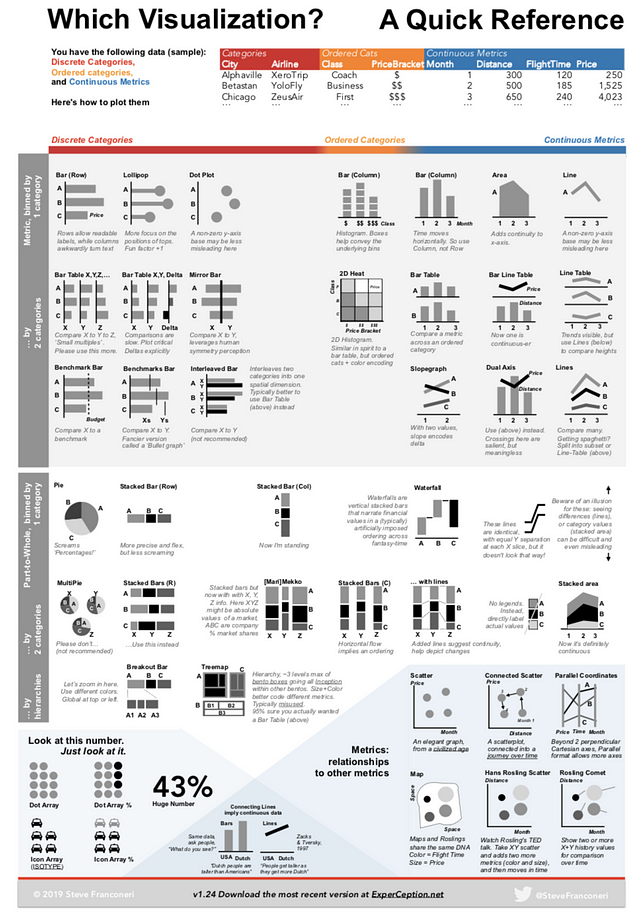
Information visualisation specialist Steven Franconeri gives this in-depth perspective on choosing the best visualisations for your data. It’s particularly interesting how he differentiates between choosing a visualisation based on the task you want your audience to perform (i.e. to see a ranking, notice a relationship or make a comparison), and choosing a visualisation based on the structure of the data (at data analysis stage, when you only have a vague idea of what the data will show).
Franconeri’s data visualization chart chooser is based on data structure rather than viewer task.