#EvalTuesdayTip: Qualitative Data Visualization, Part 1: Heat Tables
[wpseo_breadcrumb]
#EvalTuesdayTip: Qualitative Data Visualization, Part 1: Heat Tables
We recently discovered a great article about qualitative charts by Stephanie Evergreen, one of the evaluation world’s foremost experts on data visualization. “Qualitative data visualization doesn’t get the same love as quantitative,” Stephanie writes in her characteristic casual tone. “It can seem like our only option is the good ol word cloud, which my colleague Humphrey Costello famously equated to dog vomit.”
The article explains why qualitative data visualization is about more than listing quote after quote. Stephanie describes several of her favorite types of qualitative charts, including one that we also love: the heat table (or heat map).
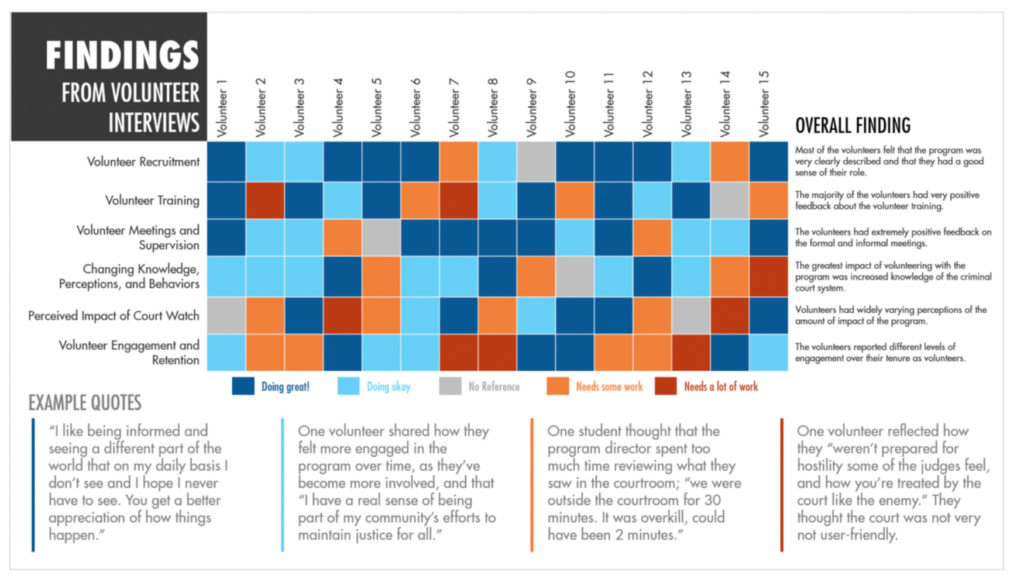
An effective example of a heat map, created by Evergreen Data.
The heat table above summarizes the findings from a series of interviews with volunteers. Responses are characterized on a color scale, with dark blue on the high end and red on the low end. Sample quotes provide examples of what each color represents.